The other side of the ledger
The scarcity of electrical capacity has become a mainstream investment thesis. J.P. Morgan Private Bank's recent analysis of the subject is representative of the genre and unusually clear: demand growth driven by data centre construction is outpacing the physical system's ability to add capacity, the resulting build-out constitutes one of the more consequential capital cycles in decades, and the sectors positioned near the bottleneck stand to benefit.
That work is written for an audience deciding what to own. Its reader is choosing among turbine manufacturers, transformer suppliers, engineering firms and independent power producers, and its central question is where the returns will accrue.
A building owner reads the same facts from the opposite side of the transaction. They are not allocating to the theme; they are exposed to it. Their position is the one that pays for the shortage, and unlike the investor they cannot express a view, size it, or exit it. They can only continue to buy the output.
This note sets out what the same evidence implies for that position.
STARTING POINT
The shortage is now documented rather than forecast
Much of the commentary on power demand remains predictive, and can therefore be discounted by anyone who disputes the underlying assumptions about artificial intelligence. The more useful evidence is the record of what has already occurred in markets that clear capacity administratively.
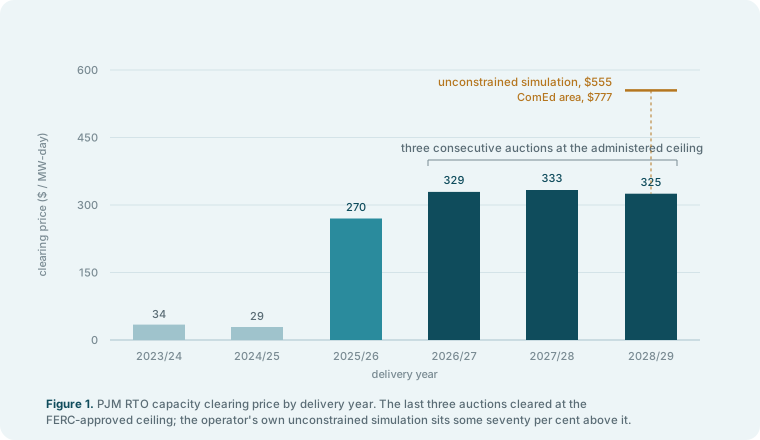
On 14 July 2026, PJM Interconnection published the results of its Base Residual Auction for the 2028/2029 delivery year. Three features of that result matter, and they should be read together rather than separately.
The auction cleared at $325 per megawatt-day, the ceiling of the price collar approved by the Federal Energy Regulatory Commission. This was the third consecutive auction to clear at the collar.
It nonetheless procured 138,318 MW against a requirement it did not meet, finishing 6,831 MW — some 5.6 per cent — short of the reliability requirement, at a reserve margin of 14.7 per cent. Reserve margins have now come in below target in two successive auctions.
And PJM's own simulation of the same auction without the collar indicates a clearing price of $554.72 per megawatt-day across the RTO, and $776.69 in the ComEd delivery area.
The auction attracted roughly 525 MW of new resources against an increase in forecast demand of approximately 2,000 MW, the latter attributed largely to data centre development.
These are not projections. They are the published results of a market in which the administered price was held at a ceiling, the market failed to procure what reliability required, and the operator's own modelling places the unconstrained price some seventy per cent above the price actually paid.
The constraint is physical, and therefore slow
The natural expectation in a market with a persistent supply deficit is that price rises until either demand is destroyed or supply arrives. Neither mechanism operates quickly here, and the reason is that the binding constraints are manufacturing and procedural rather than financial.
The J.P. Morgan analysis makes the point plainly: a project's timing depends on its position in a queue rather than on its access to capital. Interconnection waits that ran two to three years through the 2000–2015 period had extended to approximately five years by 2024, and roughly half of requests are withdrawn before reaching commercial operation. Lead times for large transformers and switchgear run eighteen to thirty-six months. Backlogs for combined-cycle gas turbines extend three to seven years. Skilled labour is not available in the quantities required. Local opposition to new load and new generation is increasing rather than diminishing.
Against this, the analysis identifies roughly $600 billion of transmission and distribution expenditure projected through 2030, following an estimated $3 trillion of under-investment since 1999, and a deficit that reaches approximately 110 GW by 2033 — the equivalent, on their framing, of adding more than twenty New York Cities to the system.
The significance for a building owner is not the size of the number but its duration. A shortage created by a shortfall of capital can be closed by capital. A shortage created by turbine backlogs, transformer lead times and interconnection queues cannot be closed inside the window in which most commercial leases are written and most holds are underwritten. In Novele's view the constraint is very unlikely to resolve materially before the end of this decade.
When price ceases to clear, allocation becomes the mechanism
The more consequential development is not the level of price but the fact that price has been prevented from performing its function.
A collar that holds the clearing price below the level at which the market would balance does not remove the scarcity. It relocates it. What is not rationed by price is rationed by other means: by queue position, by interconnection study timelines, by allocation rules, by moratoria on new large loads, and by the administrative reforms now under consideration — PJM has signalled a backstop capacity auction and a "connect and manage" framework for large new loads.
This is the point at which the exposure changes character, and it is the part of the analysis least reflected in how commercial property is currently underwritten. The risk to a building is no longer solely that power becomes expensive. It is that incremental power becomes difficult to obtain at any price, on any timetable the business can plan around.
For an owner contemplating a tenant with a materially higher load — a laboratory, a trading floor, a data hall, an electrified fleet, a retrofit that shifts heating from gas to electricity — the operative question ceases to be the tariff and becomes whether the interconnection can be secured, and when. In constrained delivery areas that question increasingly has an unsatisfactory answer.
In Novele's view this is the single most underpriced feature of the present market: the transition from a cost problem, which can be modelled, to an access problem, which cannot easily be modelled and cannot be hedged financially at all.
The allocation of cost is a political process, and commercial property is absent from it
Someone bears the cost of scarcity. In the present environment that question is being settled in regulatory proceedings that are allocating the cost of new generation among data centre developers, residential ratepayers and utility shareholders.
The magnitude of the position is worth stating plainly. Commercial buildings consume approximately 1,475 billion kilowatt-hours annually — on the order of thirty-five per cent of United States retail electricity sales, a larger share than industry and comparable to residential. This is not a marginal load being asked to absorb a rounding error. It is roughly a third of national demand.
The classification, however, matters more than the magnitude, and it is the feature of this that ought to concern owners most. In the federal statistics, data centres are counted within the commercial sector. Server consumption alone represented an estimated seven per cent of commercial sector electricity in 2025, and the Energy Information Administration's 2026 outlook projects that share reaching twenty-two to thirty-three per cent of commercial building electricity by 2050. Conventional commercial buildings and the load driving the capacity shortfall are, for statistical purposes and in many jurisdictions historically for tariff purposes, the same customer class.
The proceedings now underway are in substantial part an effort to separate them — to construct large-load tariff classes that assign the cost of new capacity to the parties requiring it. Whether that separation is performed well determines whether the residual cost of the build-out is borne by the party that caused it or by the party that merely shared a classification with it. That is the proceeding in which commercial property is not represented.
It is worth noting who is represented in it.
Commercial real estate has none of these. It is neither a politically sympathetic constituency nor an organised one. It is a large, diffuse, price-taking load with no trade position in the proceedings that determine how the cost is divided.
The reasonable expectation, in Novele's view, is that a party absent from an allocation is allocated by default, and that commercial buildings will absorb a disproportionate share of the cost of the build-out relative to their share of the demand growth that caused it.
Two qualifications should be attached to the figures above. The commercial sector as defined by the Energy Information Administration is broader than commercial real estate as an owned asset class; it includes education, healthcare, government and religious buildings alongside office, retail and hospitality. And the tariff position varies materially by jurisdiction, with several regulators now moving quickly to establish separate treatment for large loads. Neither qualification alters the direction of the argument. Both counsel against citing the aggregate figure as though it described a single organised interest — which is, in fact, the point.
The conservative case has ceased to be conservative
Our earlier note argued that the range of future power prices is weighted against the business, and that valuing storage along a single central path discards the part of the range that matters. Nothing in the present evidence requires that argument to change. What it does require is a re-weighting.
The conventional planning assumption for commercial energy escalation sits at two to three per cent. It is treated as the conservative column in a three-column model, with a base case somewhat above it and an aggressive case above that.
Novele's assessment is that the entire set has moved one position to the right.
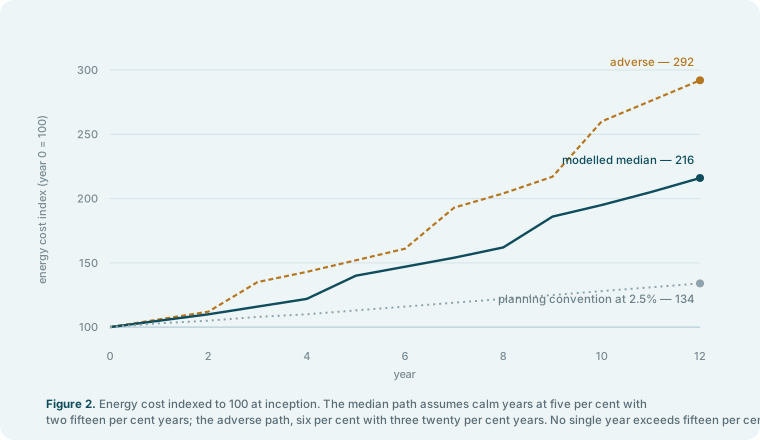
Our model does not produce a decade of double-digit escalation; that remains a tail outcome. It produces something more specific and, for planning purposes, more damaging: over a ten to twelve year holding period, most years escalate moderately — in the region of four to seven per cent rather than two to three — punctuated by two or three years of double-digit movement arising from the stress regime, with a meaningful probability that a stress episode persists beyond a single year.
The compounding consequences are considerable, and they are not intuitive.
Under a 2.5 per cent assumption, an energy cost indexed to 100 reaches approximately 134 by year twelve. Under the median path described above — calm years at five per cent with two fifteen per cent years — it reaches approximately 216. Under an adverse path with calm years at six per cent and three twenty per cent years, it reaches approximately 292.
Expressed as a variance to plan: in the median case the owner is paying roughly sixty per cent more than budget by year twelve, and in the adverse case more than double.
Two features of this deserve emphasis.
No individual year appears unreasonable. The median path contains no year above fifteen per cent and most years at five. Each figure, taken alone, would pass a budget review without comment. The damage is entirely in the compounding, which is precisely why a single-forecast appraisal cannot see it and why an experienced finance function will not instinctively flag it.
The timing of the stress years alters the cumulative outlay, not merely the terminal value. A path whose shocks land early diverges sooner and remains elevated for more of the holding period. Since it is the cumulative outlay rather than the year-twelve figure that compresses net operating income, two paths with identical endpoints can differ substantially in what they cost. This was the subject of Section 3 of our earlier note; Figure 2 is its demonstration.
The conclusion we draw is narrower than a forecast and, we think, more robust for being so. We do not assert that energy costs will compound at double digits. We assert that two to three per cent has quietly ceased to be the cautious assumption and become the aggressive one — that it now represents a bet that nothing consequential occurs for twelve consecutive years in a market that has just failed to clear. An owner still planning against it is running an unhedged directional position without having recognised that they took one.
Every constraint in the analysis is a constraint on supply
The investment literature on this subject is, almost without exception, supply-side. Turbines, transformers, transmission, interconnection, engineering capacity, siting. Each named constraint is a constraint on the ability to produce and deliver more electricity.
But a shortfall is a statement about a balance, and a balance has two sides.
A megawatt not drawn at the point of consumption during a peak hour is, to the system, equivalent to a megawatt generated and delivered to that point. It requires no turbine, no large transformer, no transmission corridor, no queue position, no rate case and no county hearing. The observation that capital cannot buy electrical power describes the supply side of the ledger. On the demand side, capital retains its purchasing power, because the constraint that renders it ineffective was never encountered.
Three considerations make demand-side capacity at the grid edge more valuable than its nameplate suggests, and more valuable per megawatt than the equivalent asset sited on the supply side.
Deliverability and losses. Resistive loss scales with the square of current, so marginal losses on a constrained feeder at peak are materially higher than the system average of roughly five per cent would imply. A megawatt of load reduction at the point of consumption therefore displaces somewhat more than a megawatt of generation at the plant, and does so at precisely the hour the system is stressed. Storage sited in a resource-rich zone but unable to be delivered into a constrained load pocket is worth less than its nameplate, and the market prices this explicitly. PJM's unconstrained simulation is the clearest available statement of that premium: $554.72 per megawatt-day across the RTO against $776.69 in ComEd. The differential is the transmission constraint expressed as a price, and it accrues to capacity already inside the constrained area.
Deferred distribution investment. In dense urban markets the dominant marginal cost is not generation but the substation and feeder capacity required to deliver it. Grid-edge storage defers that expenditure. This is neither novel nor speculative; utility non-wires alternative programmes have been procuring precisely this service for over a decade, at a scale limited principally by the difficulty of assembling distributed assets rather than by any doubt about their value.
Resilience through distribution. A dispersed fleet has no single point of failure on the power side. It is worth stating candidly that this relocates the dependency into the coordination layer: a fleet that cannot be dispatched in unison is not a fleet. That is the argument for why the control software is the substantive asset rather than an accessory to the hardware, and Novele would rather make the point than have it made.
It should also be said that this is not a new resource class requiring a regulatory campaign to establish. Demand response accounted for five per cent of the cleared supply mix in the same PJM auction that came up 6,831 MW short. The demand side is already accredited, already participating, and — on the evidence of the shortfall — materially underweight.
The constraints identified across the supply side apply unevenly to capacity sited at the grid edge. Two of them apply with equal force, and one runs against it; the remainder do not apply at all.
| Constraint on new supply | Applicability to grid-edge demand-side capacity |
|---|---|
| Gas turbine manufacturing backlog, three to seven years | Does not apply. Not a generation asset. |
| Large transformer and switchgear lead times, eighteen to thirty-six months | Largely does not apply. Behind-the-meter installation does not require transmission-class equipment. |
| Interconnection queue position, approximately five years with roughly half of requests withdrawn | Does not apply where the asset is non-exporting and sited behind the meter. |
| Transmission corridor siting, easements and eminent domain | Does not apply. The asset occupies existing building space. |
| Local opposition and moratoria on new load | Inverted. The asset reduces peak load rather than adding it. |
| Rate case and regulatory cost recovery | Does not apply. Capital is privately provided. |
| Skilled trade availability | Applies in part. Electrical labour is required, though installation is measured in days rather than years. |
| Capacity accreditation methodology | **Applies equally.** Accredited value for short-duration resources is set by ELCC and is a live policy variable, not a settled one. |
| Installed cost per kilowatt-hour | **Runs against.** Distributed capacity costs materially more per kilowatt-hour than utility-scale equivalents; the locational premium must clear that difference. |
The final two entries are the honest constraints on the argument, and Novele would rather state them than have them supplied by a reader. The remainder are the reason the demand side can be built on a timetable the supply side cannot match.
What follows
The evidence assembled here does not change the argument of our earlier note. It changes its inputs.
That note held that the future should be treated as a range rather than a point, that the range is weighted against the business, and that an asset with a floored downside and an unbounded upside should be valued across the whole distribution rather than at its centre. That framework was constructed deliberately so as not to depend on any particular view of where prices go, and it does not depend on one now.
What the present evidence supports is a re-weighting of the probability that a calm year gives way to a stressed one, and a recognition that the left tail — the flat-price world in which storage is a modest cost incurred in a benign environment — has thinned considerably. The instrument is unchanged. The distribution it is priced against has moved.
For an owner, that produces a question that is no longer only financial. It is whether to hold a position on the demand side of a market that cannot supply itself: one that caps exposure to a cost that has become large and volatile, that is not dependent on a queue, and that supplies capacity to a system which has now twice failed to procure enough of it.
Sources: PJM Interconnection, 2028/2029 Base Residual Auction Report and accompanying release, 14 July 2026. J.P. Morgan Private Bank, "Here's how scarce electricity could hamper the AI investing boom," which is itself sourced principally to BloombergNEF's New Energy Outlook 2026, the North American Electric Reliability Corporation, Lawrence Berkeley National Laboratory and Goldman Sachs Investment Research. U.S. Energy Information Administration: Electric Sales, Revenue and Price and the Electric Power Monthly for commercial sector retail sales; "U.S. electricity generation in 2025 hit a record, again," Today in Energy, March 2026, for 2025 generation and sectoral growth rates; Annual Energy Outlook 2026, released 8 April 2026, and "Data center server energy use grows across the commercial building stock," Today in Energy, May 2026, for data centre server consumption as a share of commercial sector electricity; and EIA estimates of transmission and distribution losses. Figures 1 and 2 are Novele's construction from the cited data and from the simulation model described in the appendix to our earlier note.
BRIEFING NOTE · COMPANION TO THE INTERACTIVE MODEL · VIEWS ON THE FUTURE EXPRESSED HERE ARE OUR OWN.