The flexibility shortage
Electricity is the only commodity of consequence that must be manufactured at the instant it is consumed. There is no warehouse. Supply and demand are not reconciled at the end of a trading day; they are reconciled continuously, and a failure to reconcile them is not a shortage but a blackout.
Everything peculiar about the power system descends from that single constraint. The market structures, the reserve margins, the capacity auctions, the merit order, the existence of plant that runs a few dozen hours a year — none of these would exist if electricity could be stored cheaply. They are all workarounds for a storage problem, accumulated over a century in which storage was not available at any sensible price.
This note describes what the workarounds cost, and what changes when the underlying assumption no longer holds.
The system is sized for hours it almost never experiences
Because supply must equal demand at every instant, the system must be built to serve its worst moment rather than its average one. Every element is sized this way: generation, transmission, substations, feeders, transformers. The binding constraint is the coincident peak — the single hour in which the most customers want the most power simultaneously, typically a summer late afternoon under widespread air conditioning load.
The consequence is a capital structure that would be considered indefensible in any other industry. A substantial tranche of generating plant exists to serve a small number of hours per year. Peaking units may run for tens of hours annually. They are, by design, the least efficient and most expensive plant on the system, and they are built anyway, because the alternative is to be short at the moment being short is unacceptable.
Layered on top of this is a reserve margin — an additional band of capacity above forecast peak, held against forced outages and forecast error. In PJM the target has run in the region of fifteen per cent. So the system is not merely sized for its worst hour; it is sized for its worst hour plus a margin against that estimate being wrong.
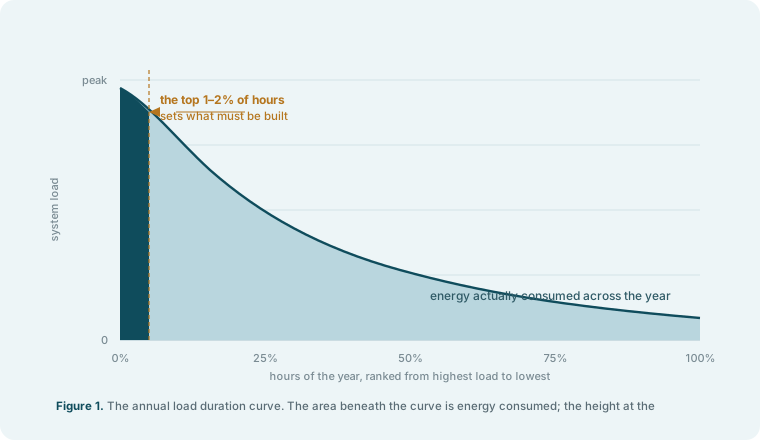
The shape of that curve is the entire economic problem. Most of the system's capital serves the broad body of the curve and earns a return on it. The last increment serves the leftmost sliver and earns almost nothing, but cannot be omitted.
For a century, all of the flexibility lived on one side
The conventional description of the supply side as "variable" inverts what was historically true. The supply side was the controllable side. That was its defining property and the organising principle of the whole market.
Load did what it did. Nobody instructed a household to defer its air conditioning. Operators accommodated load by dispatching generation to chase it, in a merit order running from cheapest and least flexible to most expensive and most responsive: nuclear and coal running flat because they are cheap and cannot manoeuvre; combined-cycle gas in the middle; simple-cycle peakers and reciprocating engines at the top, dispatchable within minutes and priced accordingly.
Flexibility was a service the supply side provided and the demand side consumed. Demand response existed at the margins, and still does — it accounted for five per cent of the cleared supply mix in PJM's 2028/2029 auction — but as an exception rather than an architecture.
Two developments have since undermined that arrangement from both ends.
The controllable share of supply is shrinking. Wind and solar are not dispatchable. Coal is retiring. Gas is queued behind multi-year turbine backlogs. The proportion of the stack that can be instructed to move is falling.
The load is growing faster than at any point in two decades, and behaving worse. Which is the subject of the next section.
Both sides of the balance are becoming harder to manage at once. That, rather than any simple shortage of megawatts, is the substance of the present reliability problem.
It is worth being precise about distributed solar in this context, because it is often misdescribed as the demand side becoming a supplier. It did not do that. It made net load at the meter volatile and weather-dependent without making it controllable — the demand side became unpredictable without becoming instructable, and the evening ramp steepened rather than eased. From an operator's chair, distributed solar without storage made balancing harder.
The demand side has therefore passed through two states and is only now entering a third: passive and predictable, then passive and unpredictable, and now — with storage and a control layer — capable of being instructed for the first time in the grid's history.
The new load does not behave like the old load
Data centres were, for twenty years, the ideal interconnection customer: large, flat, and running at high load factor. A utility could size generation and wires against that load and recover the investment through volumetric energy sales with confidence.
Training and inference workloads do not behave that way, and the difference is not marginal.
Published descriptions of the training profile show an initial ramp as datasets load, then prolonged operation near maximum utilisation, with large swings arising from the alternation between computation and communication phases, and further transients from checkpointing, intermediate saves, faults and job restarts. The defining feature is synchronisation: in synchronous data-parallel training, tens or hundreds of thousands of accelerators execute in lockstep, so their power draw moves in near unison rather than averaging out across a diverse population of servers.
The magnitudes involved are considerable. Research published jointly by scientists at NVIDIA, Microsoft and OpenAI documents swings of hundreds of megawatts ramping up and down within seconds, and identifies grid interconnection as the resulting primary bottleneck to further scaling. Modern accelerators exhibit peak-to-idle ratios between five and twenty to one — an H100 falling from roughly 700 W to 140 W during communication phases, a B200 from roughly 1,000 W to 50 W. The same body of work records facility utilisation moving from thirty per cent to one hundred per cent within milliseconds. In one incident, dozens of Northern Virginia data centres dropped off the system at once, removing approximately 1,500 MW of load instantaneously.
The North American Electric Reliability Corporation has classified these fluctuations as a high-likelihood, high-impact risk, and has moved to draft reliability standards specific to large computing loads.
The mismatch is best expressed as a comparison of rates rather than magnitudes. Thermal generation ramps at roughly five to fifty megawatts per minute; nuclear plant is too slow to respond to grid conditions at all. Synchronised accelerator clusters ramp at tens to hundreds of megawatts per second.
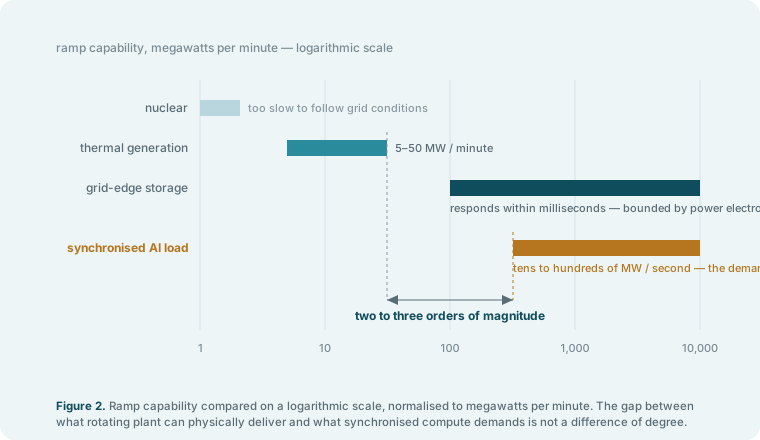
That is two to three orders of magnitude, and it is not a cost problem. It is a statement about what a rotating machine can physically do. For peak magnitude, storage is the cheaper answer. For rate of change, storage is the only answer, because nothing else on the system responds in milliseconds.
There is a second consequence, and it explains the recent hostility of utilities toward this class of customer. A utility recovers fixed capital through volumetric charges, which works when load factor is high. A facility that requires a large interconnection but draws well below it most of the time leaves the utility having built for a peak it is not paid to serve. The stranded-capital risk that follows is why minimum-take provisions and separate large-load tariff classes appeared so rapidly, and it is the mechanism behind the cost-allocation proceedings described in our previous note.
The storage hierarchy, and what has already been conceded
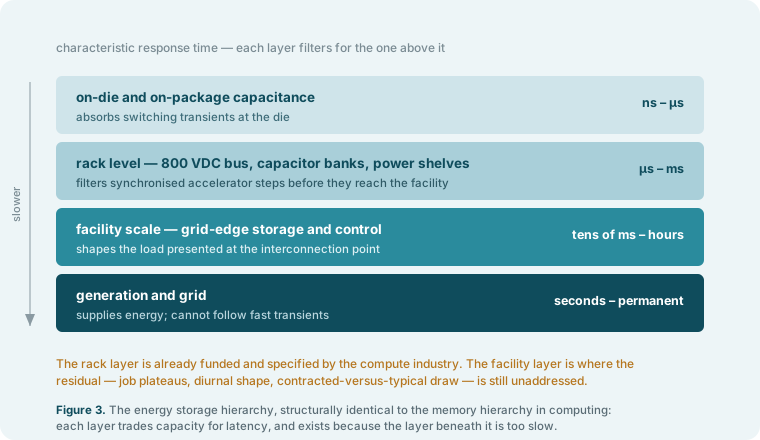
The response to the speed problem inside the industry has been to build a hierarchy of energy storage that mirrors the memory hierarchy in computing almost exactly. Each layer trades capacity for latency, and each exists because the layer beneath it is too slow.
| Layer | Characteristic response | Function |
|---|---|---|
| On-die and on-package capacitance | Nanoseconds to microseconds | Absorbs switching transients at the die |
| Rack-level: 800 VDC bus, capacitor banks, power shelves | Microseconds to milliseconds | Filters synchronised accelerator steps before they reach the facility |
| Facility-scale storage | Tens of milliseconds to hours | Shapes the load presented at the interconnection point |
| Generation and grid | Seconds to permanent | Supplies energy; cannot follow fast transients |
The reason the industry is moving to 800 volt DC distribution is the same reason computing adopted a memory hierarchy: at megawatt-scale racks the conversion stages and copper losses in the incumbent topology stopped being tolerable. NVIDIA's published rationale notes that 800 VDC transmits over one hundred and fifty per cent more power through the same copper, against a requirement of roughly two hundred kilogrammes of busbar to feed a single one-megawatt rack at 54 VDC.
What matters here is not the engineering but the concession. NVIDIA's Vera Rubin NVL144 design specifies twenty times more rack-level energy storage for the express purpose of stabilising power delivery, with the 800 V transition targeted for 2027. Flex has brought to market a UL 1973-certified capacitor energy storage system explicitly to reduce electrical disturbances arising from AI workloads. Eaton's 800 VDC reference architecture integrates supercapacitors as fast backup. Microsoft co-developed a power smoothing capability with NVIDIA that shipped in the GB200. Microsoft, Meta and Google have jointly published a specification for disaggregated power racks that separate conversion from compute.
The most sophisticated engineering organisations in the world are installing storage so that a fluctuating load does not require oversizing everything upstream of it. That is the argument of this note, implemented in silicon, at the millisecond layer, by parties with no interest in making Novele's case.
The question is not whether the principle holds. It is where in the hierarchy one stops applying it — and there is no principled reason it stops at the rack boundary. What the rack layer filters out is the microsecond content. What remains at the facility boundary is everything from tens of milliseconds to hours: the job-transition plateaus, the diurnal shape, the difference between contracted capacity and typical draw. That residual is a distinct problem, and it is the one that determines the size of the interconnection.
The flexibility already built, and never reached
If the system is sized for its worst hours, then capacity sits idle for the remainder — and that idle capacity is, in principle, available to serve additional load, provided the additional load can step aside during the hours that set the peak.
This has now been quantified at national scale. Researchers at Duke University's Nicholas Institute assessed the twenty-two largest US balancing authorities, which together serve about ninety-five per cent of national load, and introduced the concept of curtailment-enabled headroom: how much new load the existing system could absorb before exceeding what planners are already prepared to serve.
Their finding is that between 76 and 126 GW of new load could be integrated if that load can be curtailed for between 0.25 and 1 per cent of its maximum uptime. The lower figure is equivalent to roughly ten per cent of current national aggregate peak demand. At half a per cent annual curtailment, the individual balancing authorities with the largest headroom are PJM at 18 GW, MISO at 15 GW, ERCOT and the Southwest Power Pool at 10 GW each, and Southern Company at 8 GW.
Two details deserve particular attention.
The average curtailment duration in that analysis is approximately two hours, which the authors note is consistent with the capability of short-duration batteries. The requirement is defined by the shape of the peak, not by the size of the annual energy deficit.
The estimated annual curtailment time is comparable to demand response programmes already operating, which is to say the mechanism is neither novel nor untested. It is underused.
Now set that against the position described in our previous note. PJM's 2028/2029 Base Residual Auction cleared 6,831 MW short of its reliability requirement, at a price held to the administered ceiling, having attracted roughly 525 MW of new resources.
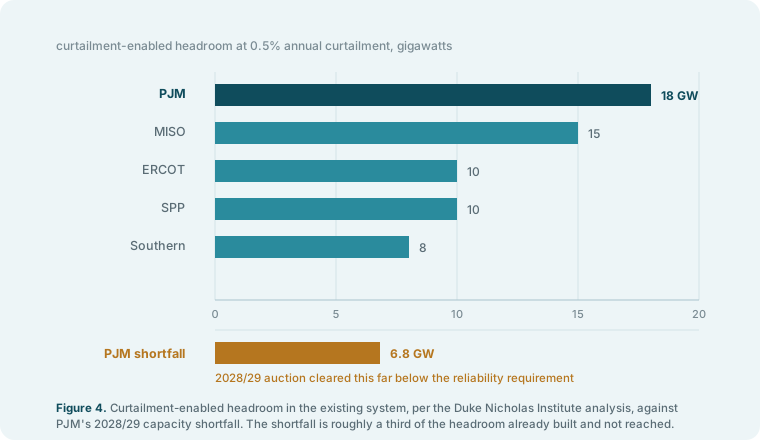
The shortfall is roughly a third of the headroom that already exists and is not being reached.
That comparison is the central claim of this note. The capacity problem is not solely a shortage of generation. It is substantially a shortage of flexibility — and the flexibility gap exists because for a hundred years the demand side has had no means of responding, so the system was never designed to ask it to.
What follows, and where the argument limits itself
The obvious objection to curtailment as a solution is that curtailment means somebody stops doing something. A data centre cannot curtail compute, because compute is the revenue. A hospital cannot curtail. A trading floor cannot curtail. This is precisely why flexible-load programmes have historically been confined to industrial processes that can tolerate interruption.
Storage dissolves that objection. It allows a facility to present a curtailed load shape at the meter while the process behind the meter continues uninterrupted. The flexibility is delivered to the system; the interruption is not delivered to the occupant.
That is what makes the Duke headroom reachable rather than theoretical, and it is what converts flexibility from a concession the customer makes into an asset the customer owns.
The implications compound in a specific order. Load flexibility relieves the coincident peak. Relieving the peak reduces the reliability requirement. Reducing the requirement reduces the quantity of capacity that must be procured, and the transmission and distribution capacity sized to deliver it. Because the system carries a reserve margin on top of forecast peak, and because marginal losses at peak exceed the system average, a megawatt withheld at the point of consumption displaces materially more than a megawatt of procured system capacity.
Three honest limits should be stated.
The timing of capital
There is a final consequence, and it returns to where the first of these notes began.
A combined-cycle plant is a three-to-seven-year lead time and a thirty-year asset life. To commit to one is to make an irreversible capital decision today against a demand forecast for the middle of the next decade — in a market where roughly half of interconnection requests are ultimately withdrawn, and in which the risk of over-building, as occurred with gas in the late 1990s, is openly acknowledged by the same analysts forecasting the shortage.
Distributed storage deploys in months, scales incrementally, and can be stopped. It does not require the forecast to be correct. It requires only that the forecast be uncertain.
That is optionality, expressed at system scale. The Duke authors frame their own finding in the same terms: flexibility as a hedge against uncertainty in future demand, permitting new load to interconnect sooner while avoiding premature investment in plant and transmission.
Which is the identical structure our first note described for a single building. There, the argument was that an asset with a floored downside and an unbounded upside should be valued across the range of possible futures rather than at a central estimate, and that the protection it carries is worth more the more uncertain the future becomes. The same instrument, at the scale of the system, has the same property for the same reason.
The grid has spent a century solving a storage problem by building capacity it rarely uses, because storage was not available. That constraint has lifted. What follows is not primarily a question of technology; the technology is in the reference architectures of the largest computing companies in the world. It is a question of whether the demand side is permitted to do at the meter what it is already doing at the rack.
Sources: Norris, T. H., T. Profeta, D. Patiño-Echeverri and A. Cowie-Haskell, "Rethinking Load Growth: Assessing the Potential for Integration of Large Flexible Loads in US Power Systems," Nicholas Institute for Energy, Environment & Sustainability, Duke University, February 2025. PJM Interconnection, 2028/2029 Base Residual Auction Report and accompanying release, 14 July 2026. North American Electric Reliability Corporation, white paper on large load reliability risk, and associated standards development activity. Joint research on synchronised workload power oscillation by NVIDIA, Microsoft and OpenAI. NVIDIA, 800 VDC architecture technical documentation and Vera Rubin platform materials. Microsoft Azure engineering publications on power stabilisation for AI training. Uptime Institute Journal on electrical considerations for large AI compute. Open Compute Project ORv3 and Mount Diablo specifications. U.S. Energy Information Administration for load shape and sectoral consumption data. Figures are Novele's construction from the cited sources.
BRIEFING NOTE · COMPANION TO THE INTERACTIVE MODEL · VIEWS ON THE FUTURE EXPRESSED HERE ARE OUR OWN.